Tampa General Hospital is committed to providing high-quality care and sharing
data about how well we follow guidelines for care. Here you will find
information from reports on key quality measures that affect the patient care
experience and health outcomes including patient safety indicators, surgical
site infections, hospital-acquired infections, and patient satisfaction. These
measures are updated as new data is collected and becomes available.
Tampa General Hospital follows guidelines established by various quality
agencies and organizations to identify best practices to ensure our patients
are receiving the safest and most innovative care in America. Tampa General’s
Quality Commitment initiatives include participation with:
- Agency for Healthcare Research and Quality
- Institute of Healthcare Improvement
- National Hospital Quality Alliance
- American Nurses Credentialing Center Magnet Program
- The Joint Commission's National Patient Safety Goals and Quality Check
- The Centers for Medicare & Medicaid (CMS) Hospital Compare.
AHCA Quality Measures and Patient Safety Information: Hospital Quality Measures and Patient Safety Information - Tampa General Hospital
Note: The data in these reports is compiled from many original sources
independent of Tampa General Hospital.
For more information,
please visit the Federal Government
and
The State of Florida's Health Finder website. If you have questions, your care team can provide more information or
direct you to Tampa General Hospital’s Quality and Patient Experience
teams.
Centers for Medicare & Medicaid Services
Tampa General Hospital has been designated as a three-star hospital in the Centers for Medicare & Medicaid Services (CMS) 2023 Overall Hospital Quality Star ratings.
CMS assigns star ratings to hospitals across the country based on the performances in five quality categories. The ranking system was created to help consumers easily compare hospitals to make informed decisions about their care. In determining the overall hospital star ratings, CMS looks at performance measures across five distinct areas of patient experience. This year, CMS rated over 4,600 hospitals from one to five stars, with 872 receiving the three-star distinction.
Patient Safety Indicators
The Patient Safety Indicators (PSIs) are a set of measures that screen for adverse events patients experience as a result of exposure to the health care system. These events are likely amenable to prevention by changes at the system or provider level.
Pressure Ulcers
out of
9,520
patients
Peri-Operative
Hemorrhage
out of
469
patients
Peri-Operative
PE/DVT
Deep vein thrombosis: A blood clot in a deep vein, usually in the legs.
out of
246
patients
Post-Operative
Sepsis
out of
139
patients
Surgical Site Infections
Surgical Site Infections (SSIs) are infections that occur after surgery in the part of the body where the surgery took place. Surgical site infections can sometimes be superficial infections involving the skin only.
Abdominal
Hysterectomy
Colon Surgery
Hospital-Acquired Infections
Hospital-acquired infections are caused by bacteria presumed to be acquired in the hospital. Patients can be infected through catheters required for care, such as intravenous lines and bladder catheters. The most common types of hospital-acquired infections are Central Line-Associated Bloodstream Infections (CLABSI), pneumonia, including Ventilator-Associated Pneumonia (VAP), Catheter-Based Urinary Tract Infections (CAUTI), and Surgical Site Infections (SSI).
MRSA
out of
6,904
patient days
C. Diff
out of
4,478
patient days
CAUTI
out of
946
device days
CLABSI
out of
1,213
device days
Patient Satisfaction
The Hospital Consumer Assessment of Healthcare Providers and Systems (HCAHPS) is a national survey that asks patients about their experience during a recent hospital stay. Tampa General Hospital performs better in overall patient satisfaction and likelihood to recommend than most hospitals in the U.S.
% of patients that rate TGH a 9 or 10 on a 0-10 scale
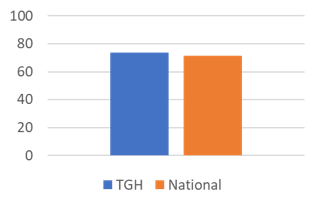
This chart shows the TGH and National values for the metric 'Percentage of patients that rate the hospital they used a 9 or 10 on a 0-10 scale'
| TGH | 71.86% |
|---|---|
| National | 69.49% |
% of patients that would definitely recommend TGH
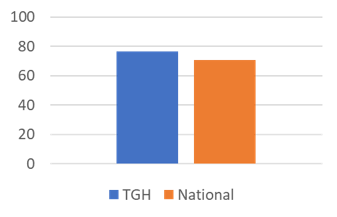
This chart shows the TGH and National values for the metric 'Percent of patients that would definitely recommend the hospital they used'
| TGH | 75.17% |
|---|---|
| National | 69.7% |